

Introduction#
Michael J. Pyrcz, Professor, The University of Texas at Austin
Twitter | GitHub | Website | GoogleScholar | Geostatistics Book | YouTube | Applied Geostats in Python e-book | Applied Machine Learning in Python e-book | LinkedIn
Chapter of e-book “Applied Machine Learning in Python: a Hands-on Guide with Code”.
Cite this e-Book as:
Pyrcz, M.J., 2024, Applied Machine Learning in Python: A Hands-on Guide with Code [e-book]. Zenodo. doi:10.5281/zenodo.15169138 ![]()
The workflows in this book and more are available here:
Cite the MachineLearningDemos GitHub Repository as:
Pyrcz, M.J., 2024, MachineLearningDemos: Python Machine Learning Demonstration Workflows Repository (0.0.3) [Software]. Zenodo. DOI: 10.5281/zenodo.13835312. GitHub repository: GeostatsGuy/MachineLearningDemos ![]()
By Michael J. Pyrcz
© Copyright 2024.
About this e-book#
This e-book provides an accessible, online version, a new vehicle to share my Machine Learning Graduate Course at The University of Texas at Austin, that includes,
Well Documented Demonstration Python Workflows - almost half the lecture time is spend with these workflows from my MachineLearningDemos GitHub repository, that includes well-documented demonstration Python Jupyter workflows for many common machine learning workflows. One goal of this e-book is to share this content beyond the GitHub users, often only the experts and developers - to reach and help more people!
Course Notes - I’m also making an effort to continue adding more of the course notes into this e-book, to provide even more coverage of theory and implementation details.
Interactive Python Dashboards - I have a lot of interactive Python dashboards that I use in my classes that I will continue to explain and cite in this e-book to help you get the entire in-class experience. These are all available in my DataScienceInteractivePython GitHub repository.
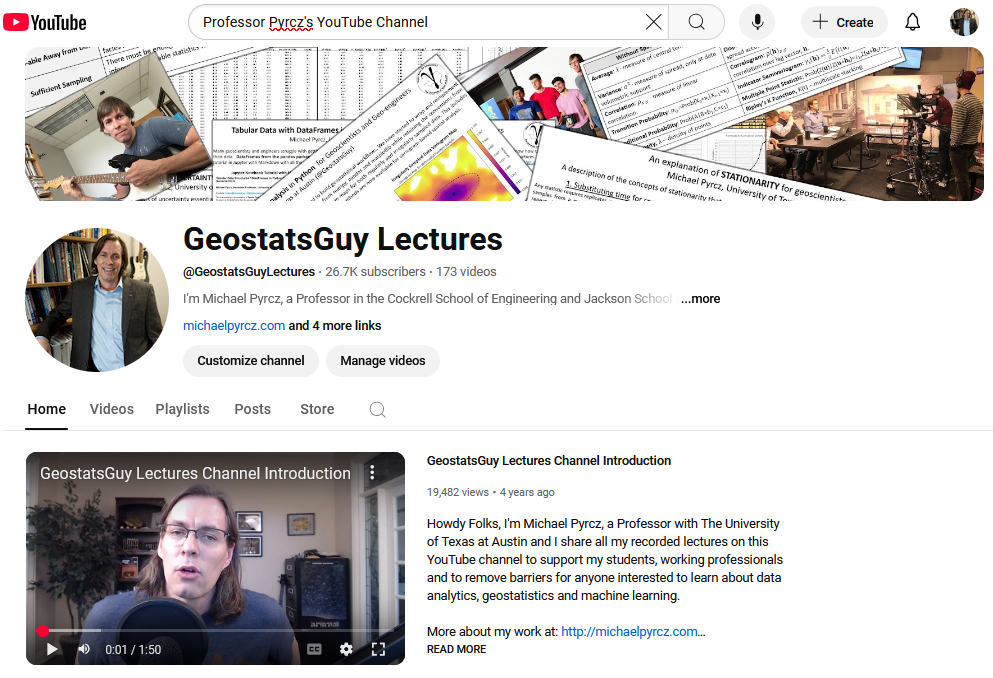
Recorded Lectures - there are many thousands of views of my lectures every month on YouTube channel in the Machine Learning course playlist. The recorded lectures provide many more explanations to support you!
Welcome!
The scope of this e-book is to teach the application of machine learning in Python, for those new to machine learning I provide and overview of theory and links to my recorded lectures for a deeper dive, and for those experienced practitioners I provide example and enhanced workflows and visualizations that you can implement.
This is my second effort to convert one of my The University of Texas at Austin courses, based on well-documented Python workflows into an online, accessible e-book.
For those interested in data analytics, spatial data analytics and geostatistics, I welcome you to visit my other e-book, Applied Geostatistics in Python: a Hands-on Guide with GeostatsPy[] based on my, Data Analytics and Geostatistics undergraduate course and my geostatistics Python package, GeostatsPy.
The great response to this e-book from students and working professionals all over the world motivated me to compile, build and release this e-book,
the original repository for the workflows in this book are found at MachineLearningDemos: Python Machine Learning Demonstration Workflows Repository [Pyr24d], but rest assured every chapter in this book is a Jupyter Notebook or Jupyter Lab .ipynb file that may be downloaded and run locally.
all I ask is that you retain my authorship and cite the source when my work is used. My motivation is to attract more people to all of the resources that I share online! Please consider citing and linking these resources in your work. See the citation at the top of this introduction.
The ultimate source for the content in this e-book is my semester-long Machine Learning graduate course, so I have made scope decisions based on the educational narrative in my course,
I believe that 80% or more of any data science is data preparation so I spend 1/3 of the course on workflow design, probability concepts, data preparation and feature engineering before we turn on any machines
I spend a lot of time on simple machines, like linear regression and the regularized variants to teach fundamental theory
I step through specific methods to build up concepts, for example, \(L^2\) vs \(L^1\) norms, regularization, convolution, bootstrap and bagging, Bayesian approaches, etc.
I have chapters on deep learning that will be added shortly.
I made an effort to order the chapters to build up the concepts of machine learning, from feature engineering, through inferential machine learning and up to predictive machine learning. The predictive machine learning is ordered to start with linear regression, introduce hyperparameter tuning with ridge regression, introduce basis expansion with polynomial regression, integrate Bayesian methods with Bayesian linear regression, demonstrate lazy vs. eager learning with k-nearest neighbours, present ensemble methods with trees, etc.
If you work through the chapters in order you will benefit from this “scaffolding”” and “spiraling” approach to education that I like to apply in all of my courses.
Nevertheless, each chapter is designed to be a stand-alone resource, in most cases you could readily plug and play your own dataset. Remember to cite the e-book and repositories in your work, and bring me a breakfast taco if you pass through Austin!
This e-book is not a general introduction to statistics nor is it a comprehensive treatment of machine learning,
for a deeper dive into the theory and practice built on fundamental probability and statistics follow the links at the top of each chapter to my recorded lectures on my Machine Learning Course [Pyr24a] playlist on my YouTube channel.
of course, there are excellent books for machine learning theory, one of my favourites is The Elements of Statistical Learning: Data Mining, Inference, and Prediction [HTF09].
Linked Recorded Lectures are Available
For a deeper dive into the theory and practice of geostatistics follow the links at the top of each chapter to my recorded YouTube lectures.
In case you are interested, my YouTube channel includes 3 complete courses:
along with additional supplemental series including:
Data Science Interactive Python Demonstrations - walk-throughs for many of my interactive Python data science dashboards
Data Science Basics in Python - basics like loading and visualizing data, prerequisites for this e-book
Random Talks - some of my talks on topics such as data analytics, geostatistics and machine learning, and even talks titled,
“Choosing Between Industry and Academia”
“Michael’s Unsolicited Career Advice”
“New Research in Subsurface Data Analytics and Machine Learning”
“A Professor’s Secret Weapon”
“Applying Machine Learning as a Compentent Engineer or Geoscientist”
Table of Contents#
Here is the table of contents with links to each chapter in this e-book. Note, there is a navigation bar on the left (on desktops) and a pull down navigation bar (on phones). Also, the Glossary provides links to the chapters that define each of the terms.
- Machine Learning Concepts
- Training and Tuning
- Workflow Construction and Coding
- Probability Concepts
- Loading and Plotting Data and Models
- Univariate Analysis
- Multivariate Analysis
- Feature Transformations
- Feature Ranking
- Feature Imputation
- Cluster Analysis
- Density-based Clustering
- Spectral Clustering
- Principal Components Analysis
- Multidimensional Scaling
- Random Projection
- Prediction with scikit-learn
- Linear Regression
- Ridge Regression
- LASSO Regression
- Bayesian Linear Regression
- Naive Bayes
- Polynomial Regression
- k-Nearest Neighbours
- Decision Trees
- Bagging Tree and Random Forest
- Gradient Boosting
- Support Vector Machines
- Neural Networks Activation Functions
- Artificial Neural Networks
- Convolutional Neural Networks
- Autoencoder Neural Networks
- Generative Adversarial Networks
- Attention
- Time Series Analysis and Modeling
- Python Code Snippets
- Synthetic Datasets
- Conclusions
- Glossary
- References
Recent Updates#
Here’s some highlights from recent updates to this e-book:
What’s New with Version 0.0.1#
this is the first release. Thank you for joining in early! Sorry, there are many minor formatting issues that I will resolve over the next couple of months. I welcome feedback with errata. I appreciate any assistance.
I will be looking at practical methods to integrate my Interactive Educational Data Science Python Dashboards interactive dashboards [Pyr21], and more from my Machine Learning Lecture Series [Pyr24a].
What’s New with Version 0.0.2#
added new sections for feature engineering, machine learning concepts overview chapter, and a glossary!
I’m making efforts to catch and correct error, links, spelling and grammar
Motivation for Open Educational Content#
There is more to be done, yet I am excited to compile all this content into an accessible format, linked to lectures and with repeatable code. My goal is to help people get started or to improve their application of machine learning. With an e-book, I realize my dream of sharing educational content with,
living documents, I will continuously make improvements and add new content over time, so send me suggestions and errata and return often!
repeatable results, all examples and plots show the code and anyone can reproduce all the results! The code is immediately downloadable, and all data are online available.
links, for rapid access to all associated resources, bringing together all of my educational content.
no pay wall, for anyone around the world to access my content.
For me, this is a wonderful vehicle to combine and share all my educational content. Yes, thousands can follow and mirror my workflows on GitHub, but the e-book will share this content much more widely. I see this with my YouTube channel with tens of thousands of subscribers and as many views per month vs. my GitHub account with about 3,600 following.
accessible and actionable educational content is my personal mantra.
Some might wonder, why does Michael do this? Check out my story and you will learn that education changed my life. Here’s the summary,
I grew up in a low income family in a small town in Canada.
a random engineering student talked to me in a gas station late one cold evening and that got me interested in an university education.
I supported myself and young family through an engineering B.Sc. and Ph.D., and as a result had a challenging, exciting and rewarding career.
Now it is my mission to share all my university educational content in that hope that I may lift someone else as I was lifted.
Before we get started, here’s more information about the workflows in this e-book’s chapters and my interactive Python dashboards.
Machine Learning Demonstrations#
When I teach I avoid “copy and paste”, instead,
every example is real and repeatable. Students can access the codes and data and run the classroom demonstration examples for themselves.
For example, when I teach probablity density functions as part of data analytics, I show an example with different kernels.
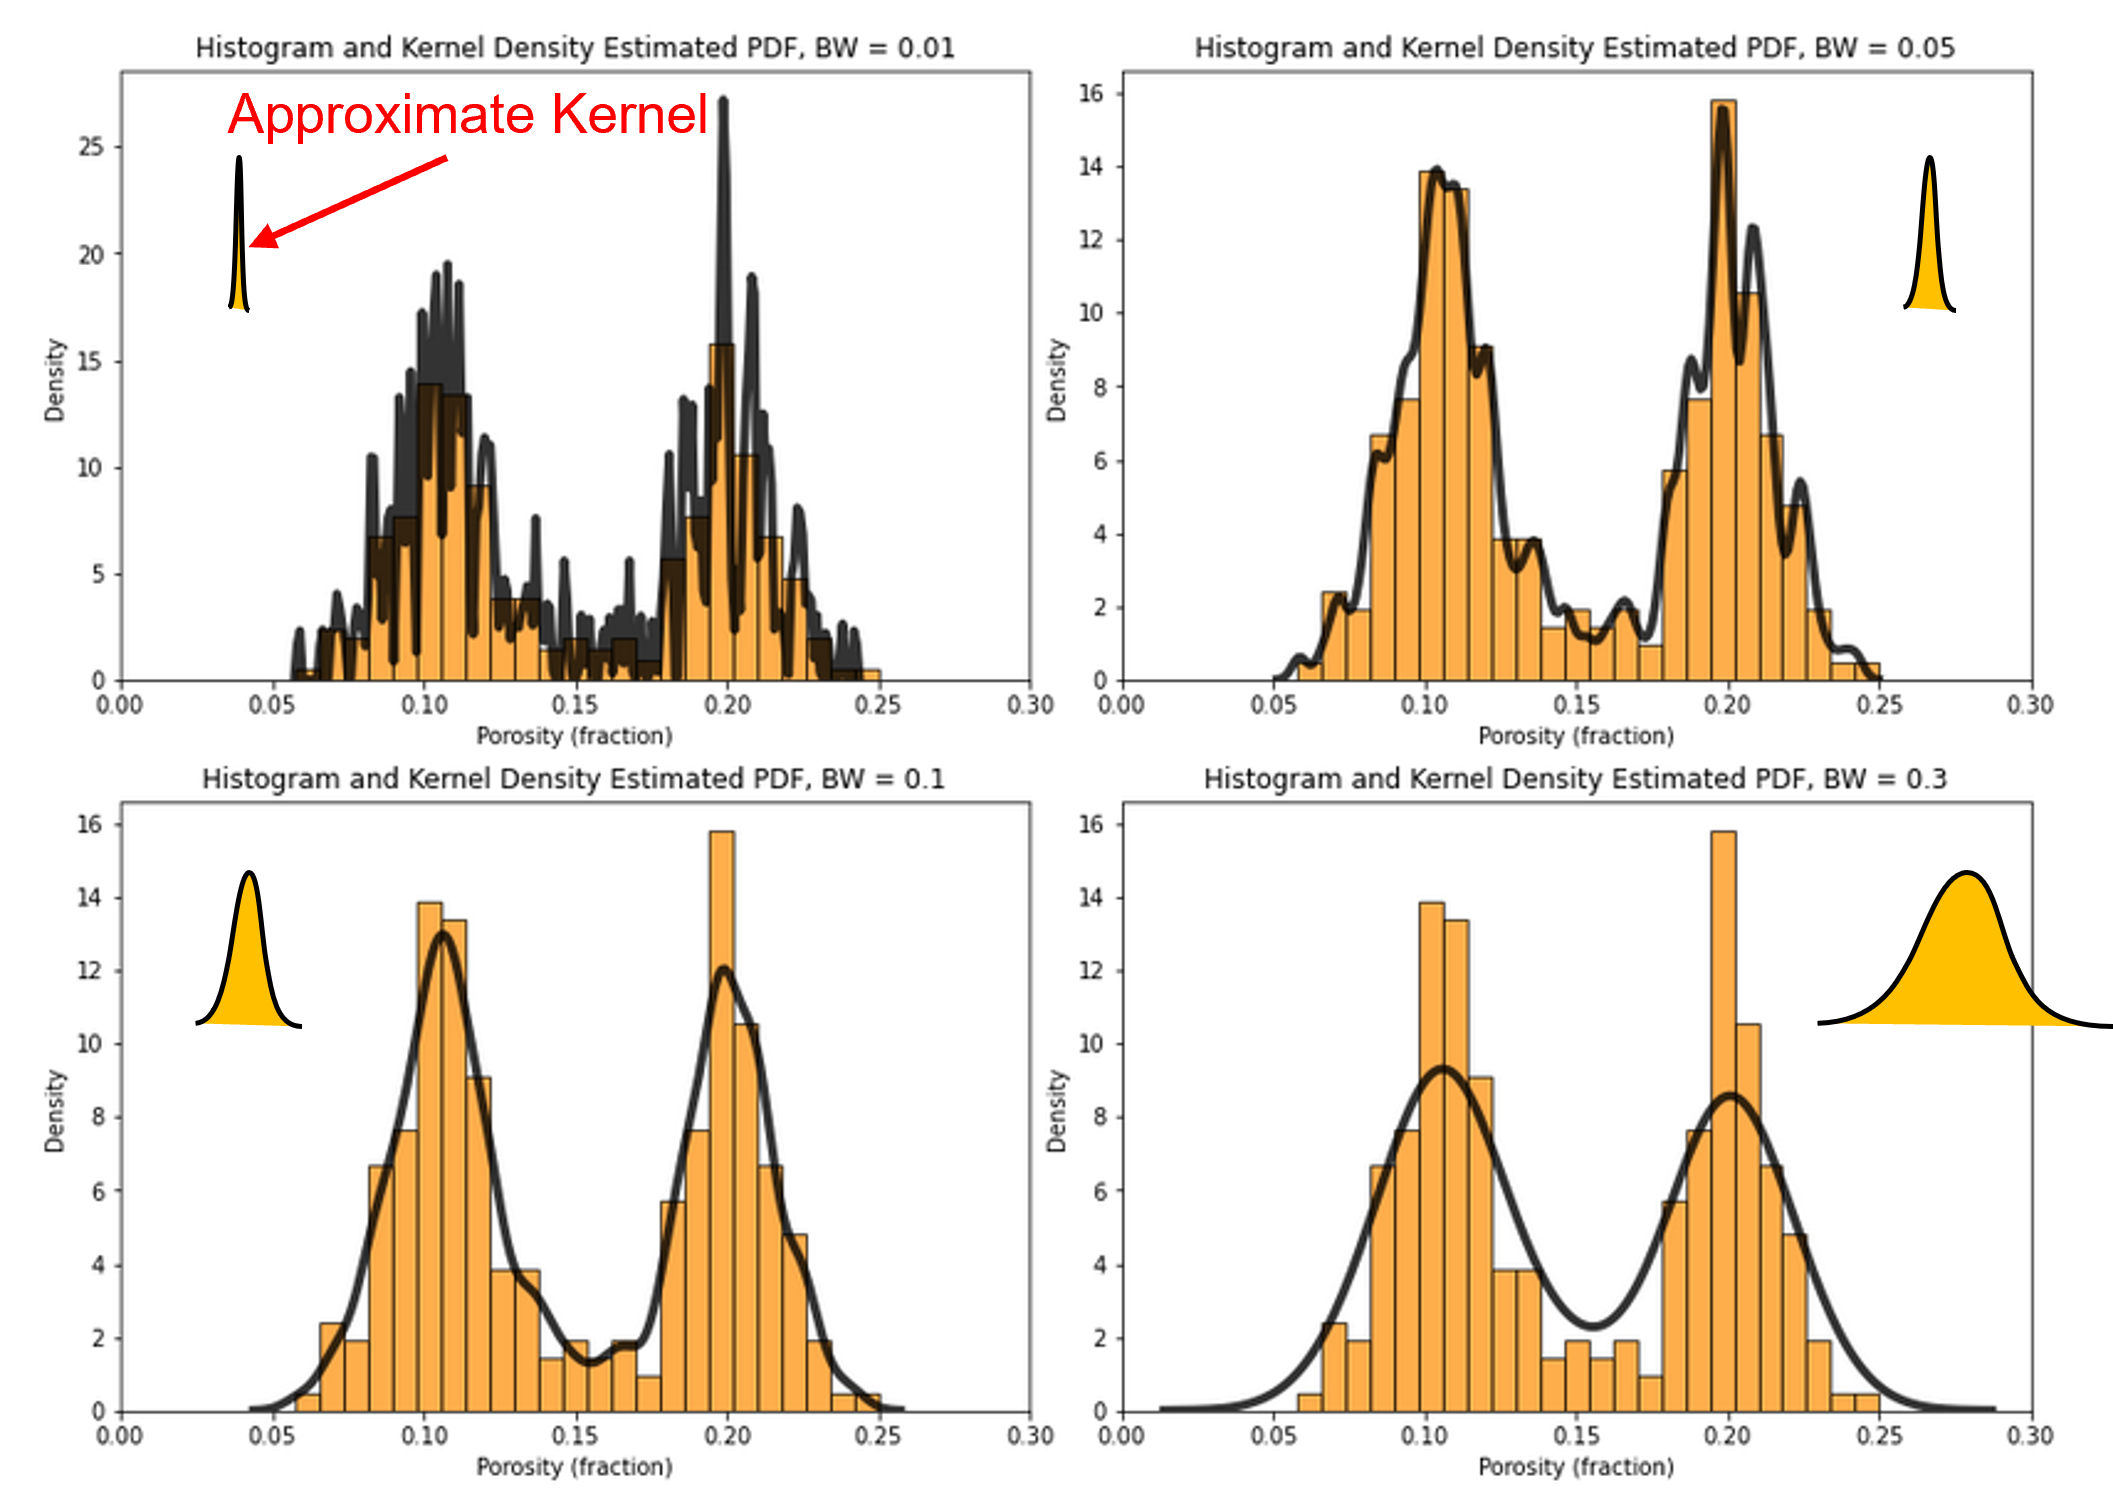
In the course notes plot caption, I include the link to the workflow to reproduce this method and the actual plots, included in this e-book chapter Univariate Analysis.
Each machine learning chapter in this e-book is a downloadable well-documented workflow,
utilizing synthetic data from my GeoDataSets repository
small and often 2D examples for fast run times and ease of interpretation
Common machine learning workflows include,
multivariate analysis
feature selection
feature transformations
cluster analysis
principal component analysis
linear regression
ridge regression
LASSO regression
Bayesian linear regression
naive Bayes classification
polynomial regression
k-nearest neighbours
decision trees
bagging trees and random forest
gradient boosting
support vector machines
I have many other machine learning and data science workflows in my other repositories. As I prepare these for this e-book I will add them to this repository. Let me know if there are other topics of interest.
artificial and convolutional neural networks are next!
Data Science Interactive Python Repository#
One of my favourite things to do is to build out Python interactive dashboards to support my lectures. Here’s an example screen shot of one of my interactive dashboards for Bayesian updating,
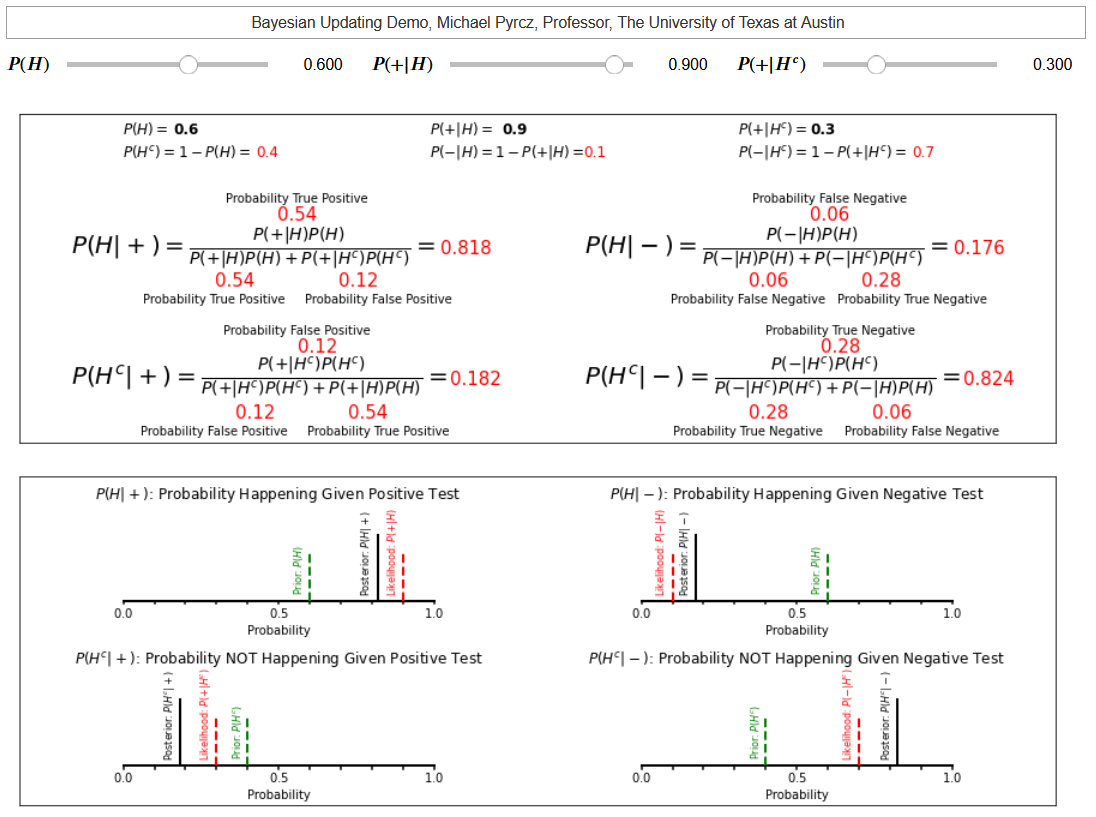
I think it is awesome to teach a concept and then to get the students to open a dashboard and rapidly try it out, i.e., to play with the system!
You are welcome to explore my over 50 interactive data science Python dashboards in my Data Science Interactive Python repository on GitHu, including interactive,
Bayesian updating
bootstrap
central limit theorem
correlation coefficients
k-means clustering
density-based clustering
spectral clustering
linear, ridge and LASSO regression
model hyperparameter tuning and overfit
principal component analysis
variogram calculation and modeling
spatial estimation and simulation
decision making in the presence of uncertainty
artificial neural networks
This has been a lot of work, but what motivates me?
I’m a visual learner - yes I understand the math and systems, but seeing them in action is really helpful to me. I know that many are like me.
one of the best way to answer questions in class - a student asked, what do principal component loadings look like? That evening I made a really cool dashboard with one input, amount of correlation between 3 features with another one independent. The outputs included the principal component loadings and variance explained by each principal component. It showed so much, including conservation of variance, and component one as a mixture of the three correlated features as the correlation increased.
I really like doing this - I left industry to give back and have fun. I like to code and I love to make data science displays.
For now I will add links to these interactive dashboards.
in the future I would like these to be included in the e-book live and interactive. The jupyter-book hosted on GitHub does not allow for this at this time.
Running the Workflows in this e-book#
You can use this e-book, i.e., read and review the workflows, without ever running the code. I recommend that you run the code yourself to cement the concepts.
to do this you only need to install the required Python packages.
The good news is that I generally use the common Python packages curated and available through Anaconda. There will be a couple of additional packages to install including,
geostatspy - my spatial data analytics and geostatistics package for some data transformations and visualization
pyvista - 3D grid visualization
astropy - sparse data convolution
shap - Shapley values for explainable machine learning and feature ranking
These packages are well maintained and can all be installed with:
pip install [package_name]
from a terminal window.
I like to launch the terminal window from Anaconda Navigator from the ‘Environments’ tab and left click the green arrow and select ‘Open Terminal’. This will ensure that the package is installed in the correct location. After teaching 100s of students and seeing many issues, this is my suggestion for the safest way to install Python packages.
Suggestions for Using this e-book#
This is a topical approach to the hands-on application of machine learning. Each chapter stands alone and covers a unique machine learning method.
Want to rank your features?
Want to perform cluster analysis?
Want to train and tune a random forest model?
Open up the respective chapter and walkthrough the example with all requisite steps, including data loading, data visualization and modeling steps, with all codes available and explained through text and comments and the results shown.
in fact, I went the extra mile to show as much as possible with graphical outputs with efficient figures.
While doing this, you can go to the linked lecture(s) to fill in any gaps in your knowledge and then download and update the workflow for your application.
please remember to cite the e-book in your work, so that others will see and use this resource!
Remember, that this content is for educational purposes only and I do not provide any guarantees.
there may be errors in the codes, there may be issues with your case that invalidate the assumptions of the e-book’s workflows. It is up to you to evaluate your results.
Warning
If you adopt any workflows from this e-book you must check your own work.
About the Author#

Michael Pyrcz is a professor in the Cockrell School of Engineering, and the Jackson School of Geosciences, at The University of Texas at Austin, where he researches and teaches subsurface, spatial data analytics, geostatistics, and machine learning. Michael is also,
the principal investigator of the Energy Analytics freshmen research initiative and a core faculty in the Machine Learn Laboratory in the College of Natural Sciences, The University of Texas at Austin
an associate editor for Computers and Geosciences, and a board member for Mathematical Geosciences, the International Association for Mathematical Geosciences.
Michael has written over 70 peer-reviewed publications, a Python package for spatial data analytics, co-authored a textbook on spatial data analytics, Geostatistical Reservoir Modeling and author of two recently released e-books, Applied Geostatistics in Python: a Hands-on Guide with GeostatsPy and Applied Machine Learning in Python: a Hands-on Guide with Code.
All of Michael?s university lectures are available on his YouTube Channel with links to 100s of Python interactive dashboards and well-documented workflows in over 40 repositories on his GitHub account, to support any interested students and working professionals with evergreen content. To find out more about Michael?s work and shared educational resources visit his Website.
Want to Work Together?#
I hope this content is helpful to those that want to learn more about subsurface, spatial modeling, data analytics and geostatistics. Students and working professionals are welcome to participate. I’m happy to collaborate with your organization.
Want to invite me to visit your company for training, mentoring, project review, workflow design and / or consulting? I’d be happy to drop by and work with you! I am a cofounder of a data science education company.
Interested in partnering, supporting my graduate student research or my Subsurface Data Analytics and Machine Learning consortium (co-PIs including Profs. Foster, Torres-Verdin and van Oort)? My research combines data analytics, stochastic modeling and machine learning theory with practice to develop novel methods and workflows to add value. We are solving challenging subsurface problems!
I can be reached at mpyrcz@austin.utexas.edu.
I’m always happy to discuss,
Michael
Michael Pyrcz, Ph.D., P.Eng. Professor, Cockrell School of Engineering and The Jackson School of Geosciences, The University of Texas at Austin
More Resources Available at: Twitter | GitHub | Website | GoogleScholar | Geostatistics Book | YouTube | Applied Geostats in Python e-book | Applied Machine Learning in Python e-book | LinkedIn